Page - Blog Single Column Left Sidebar
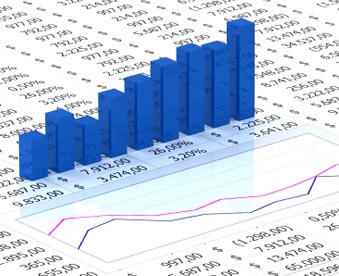
Graphical Market Data Chart
Graphical Market Data Chart Application Development for a leading financial services company
Key Achievements
- Helps identify the possible future trends
- Data visualization made easy
- Communicates message clearly and effectively
- Chart covers extreme range of values
Client
The client is a research-driven financial services and products company. They engage in the research and analysis of the financial markets, generate proprietary theoretical models and develop original risk metrics. The client also looks into the process of developing electronic trading platform to provide powerful portfolio and risk management tools and automated trading systems.
Challenges
The client wanted to plot Indicators on the Market Data Chart as an object based on its own formula.
What We Did
ANGLER collected the type of indicators list and analyzed its formula and applied the business logic for that indicator and created as a Plug-in for the core application
Technologies Used.

Results
User can apply the Indicators on the Market data chart and be able to predict the future of the commodities
Related Case Studies